Controlling the efficiency of your business is a big stress. This is why iGMS designed an aggregated analytics asset that helps you visualize your performance and draw the necessary conclusions.
With the iGMS Dashboard you, as an iGMS account holder, can quickly check the pulse of the most important metrics of your short-term rental business.
Where can I find the iGMS Dashboard?
You can find the Dashboard section at the very top of the main iGMS menu.
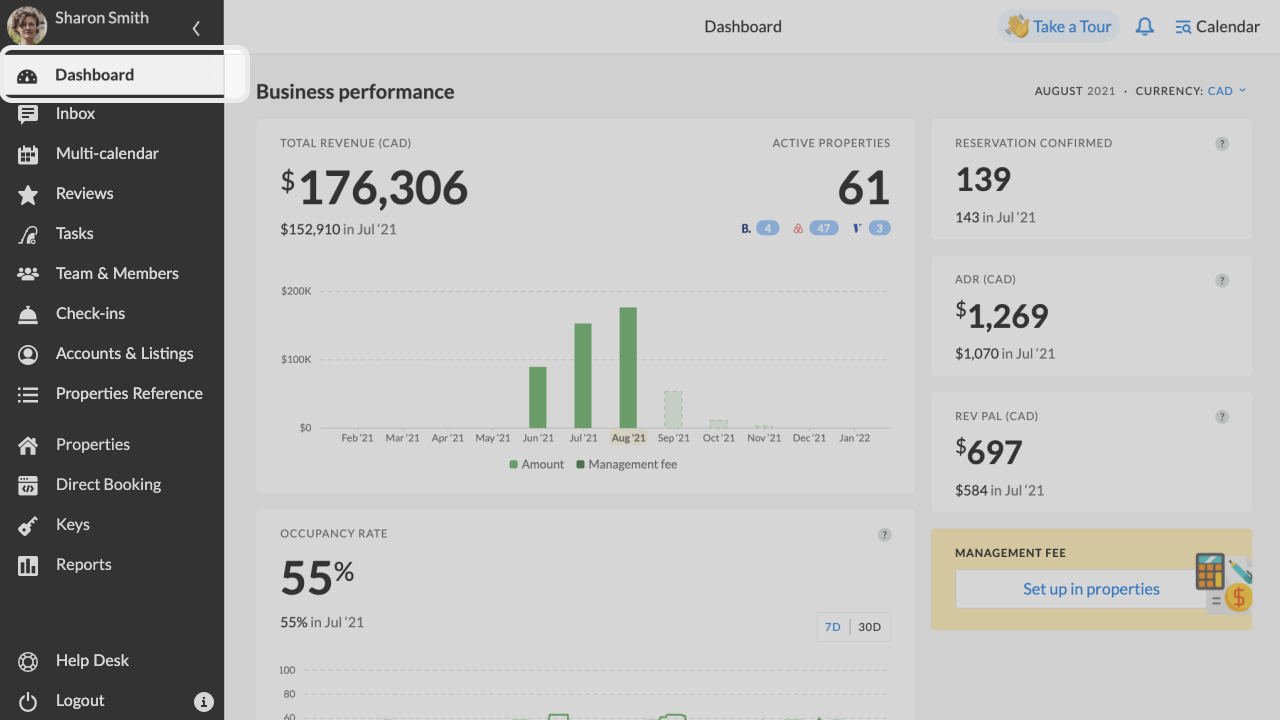
The Dashboard aggregates your data from all the booking channels and converts it to insights and valuable numbers. The Dashboard contains two blocks of information: one is dedicated to showing your business performance and revenue, while the other one focuses on your guests, communication, and reservations. You will see the current month’s data, which is also updated in real time.
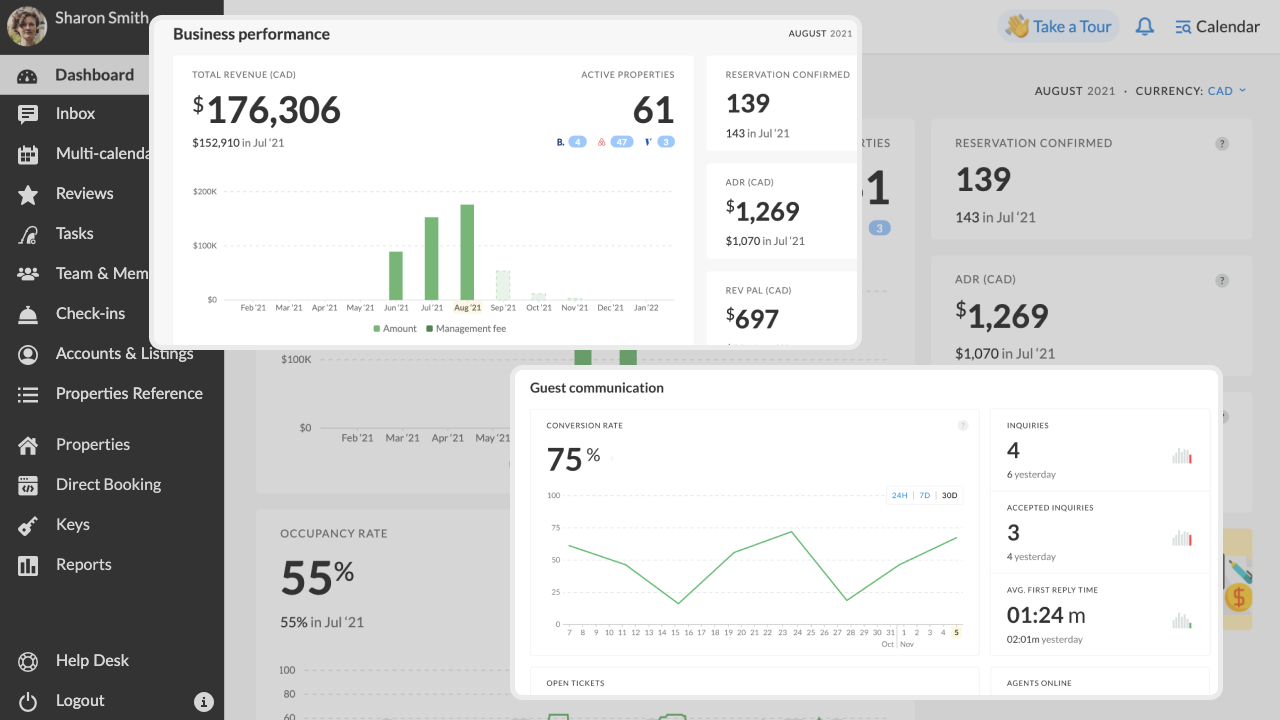
If you are using PROtrack, you will also have a dedicated section in the Dashboard with the vital PROtrack metrics.
How do I read my business performance metrics?
At the very top, you will see the current month and currency of your account. The currency can be changed, if needed.
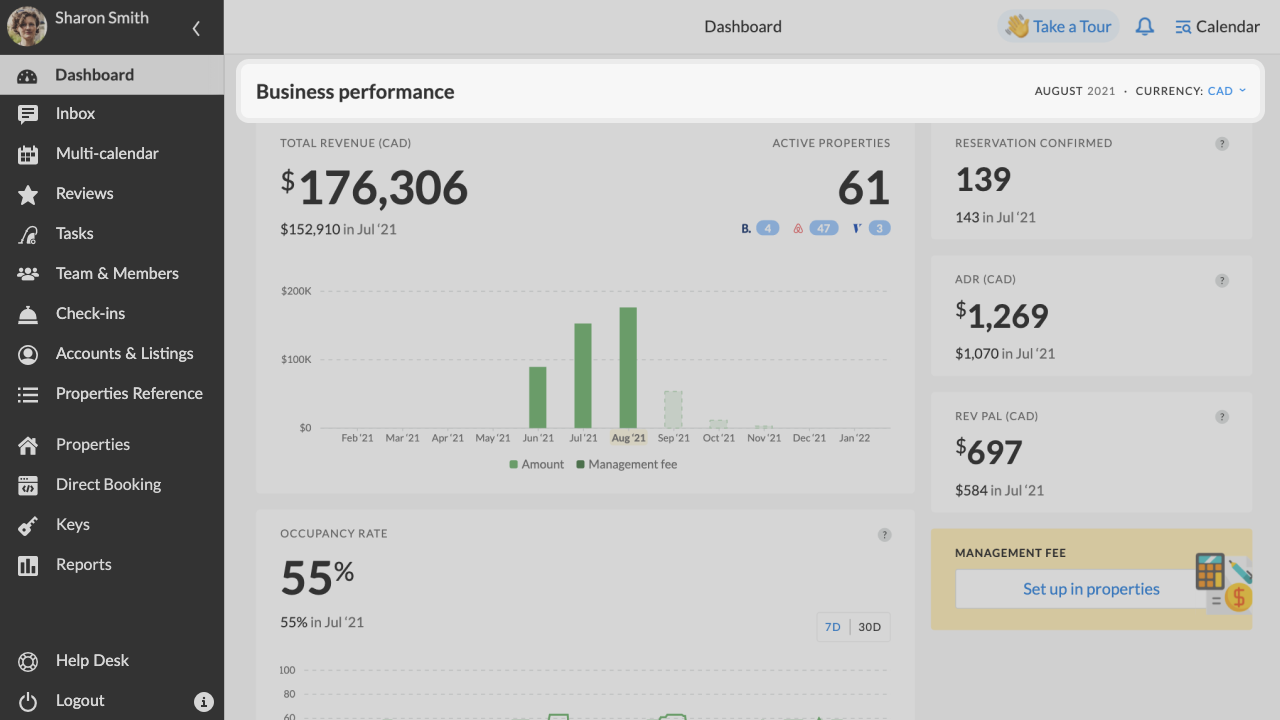
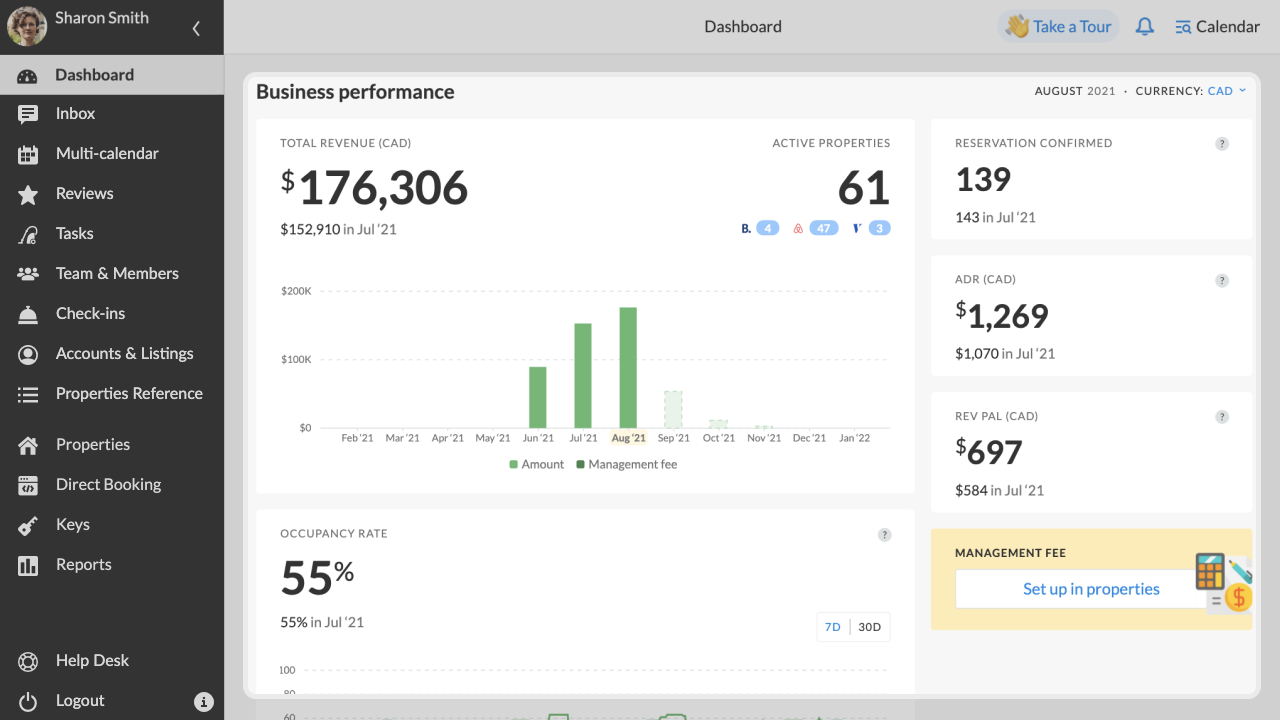
In the Business performance section, you will find such metrics as:
- Total revenue in the selected currency
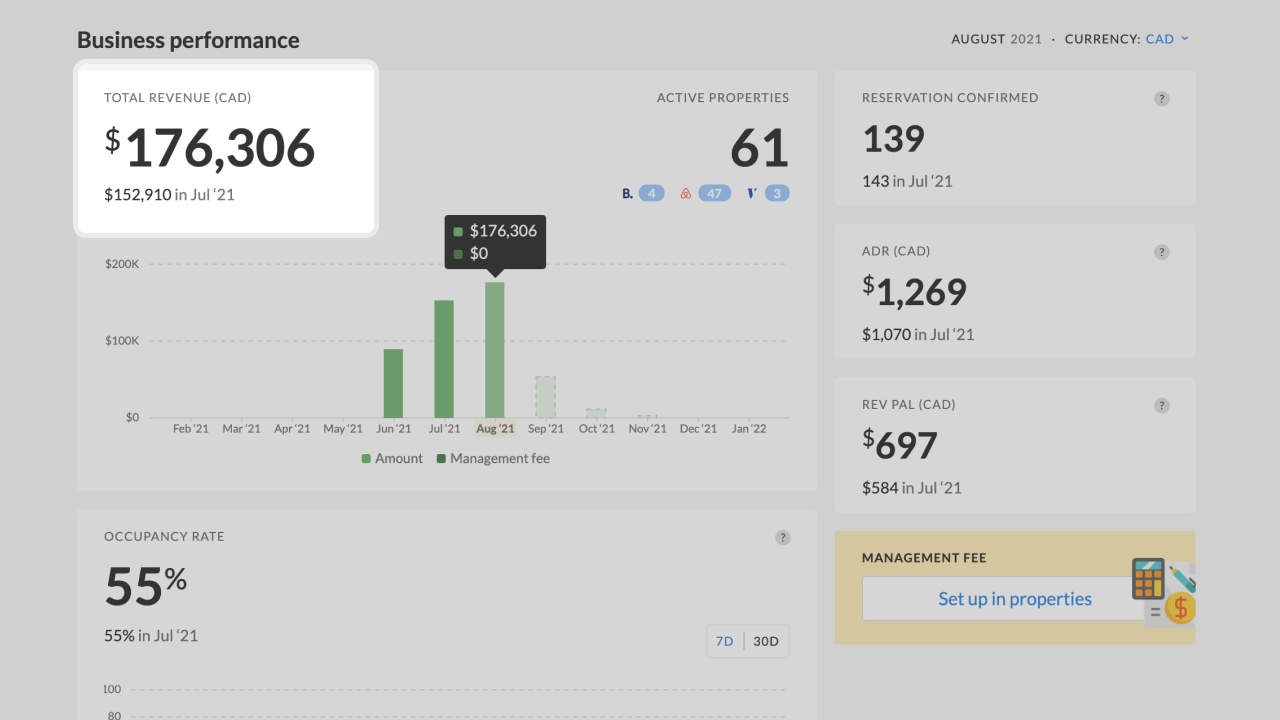
- Number of active properties on iGMS
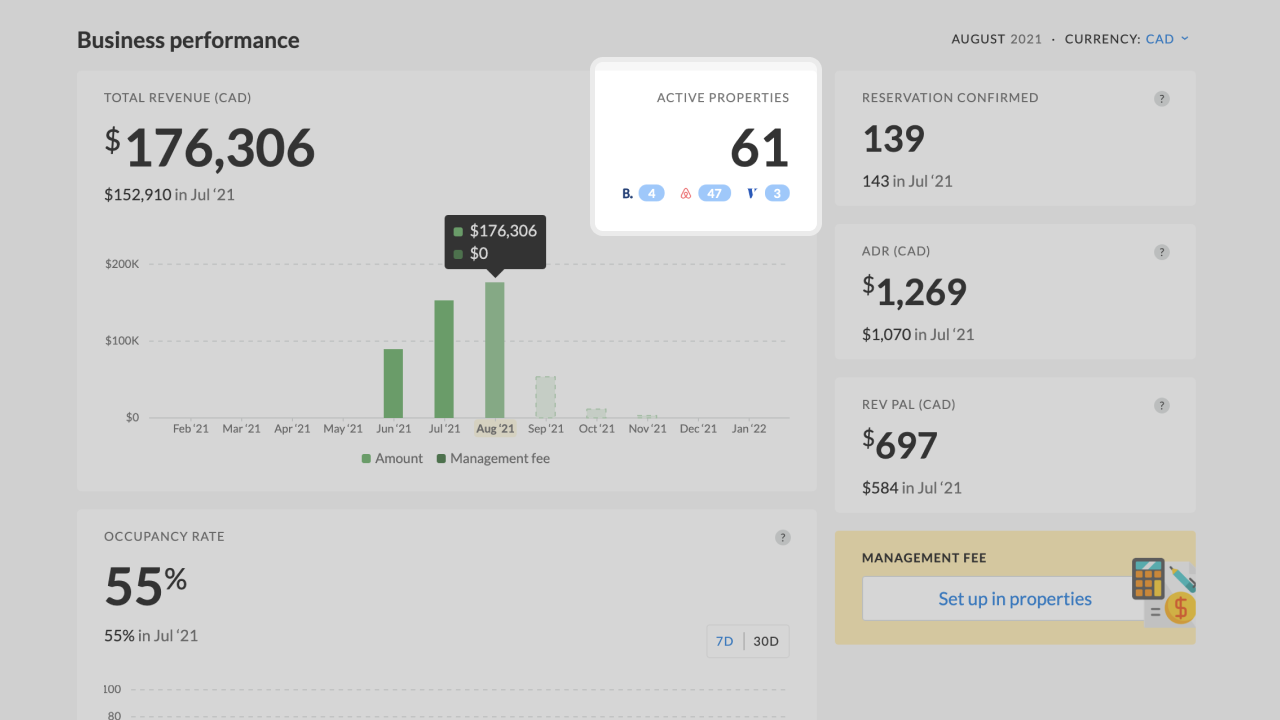
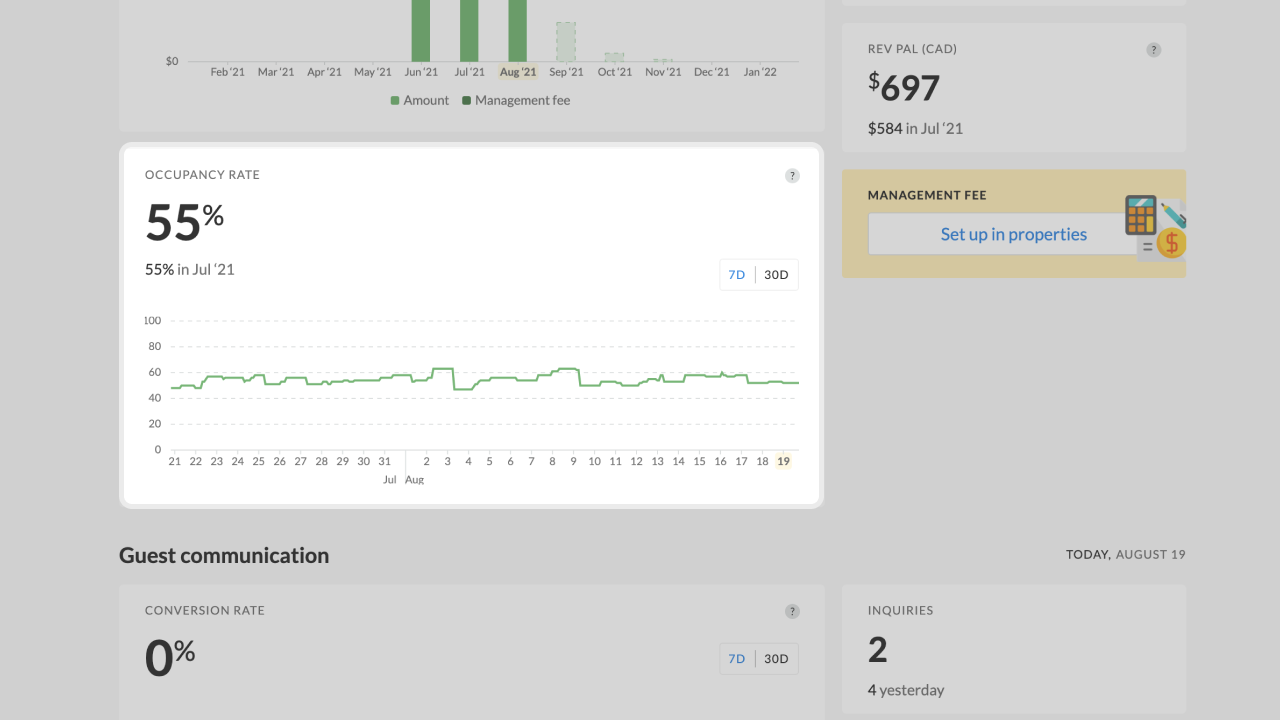
- Occupancy rate which is calculated by dividing the number of nights booked by the total nights available
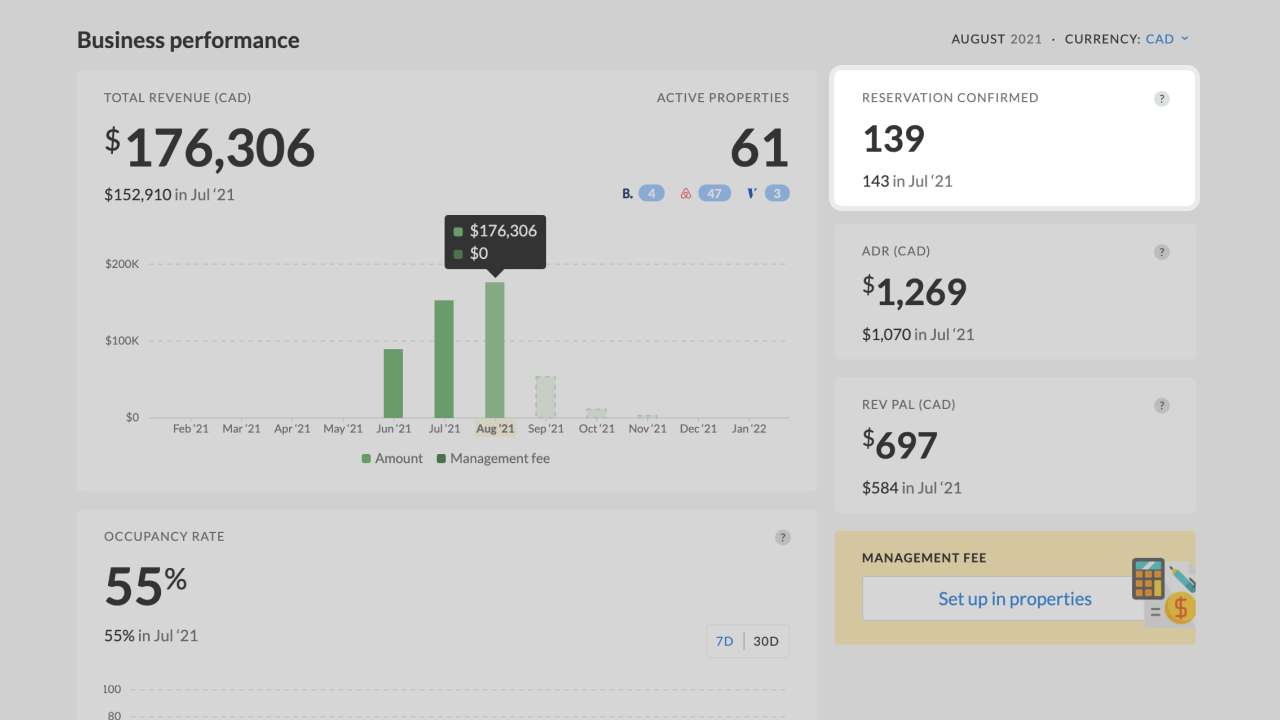
- Number of confirmed reservations this month
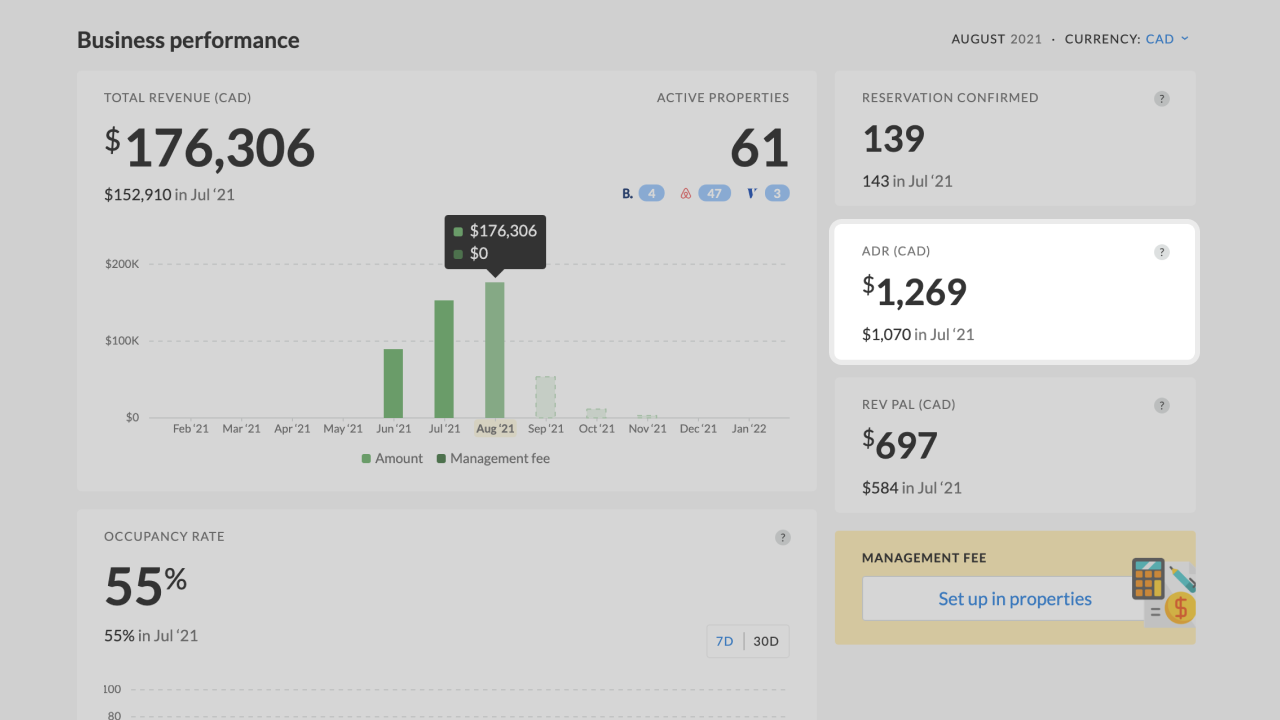
- ADR – Average daily revenue which is calculated by dividing your revenue by the number of sold units
- Rev PAL – Revenue per available listing (property) which is calculated by multiplying the average cost per property by the occupancy rate
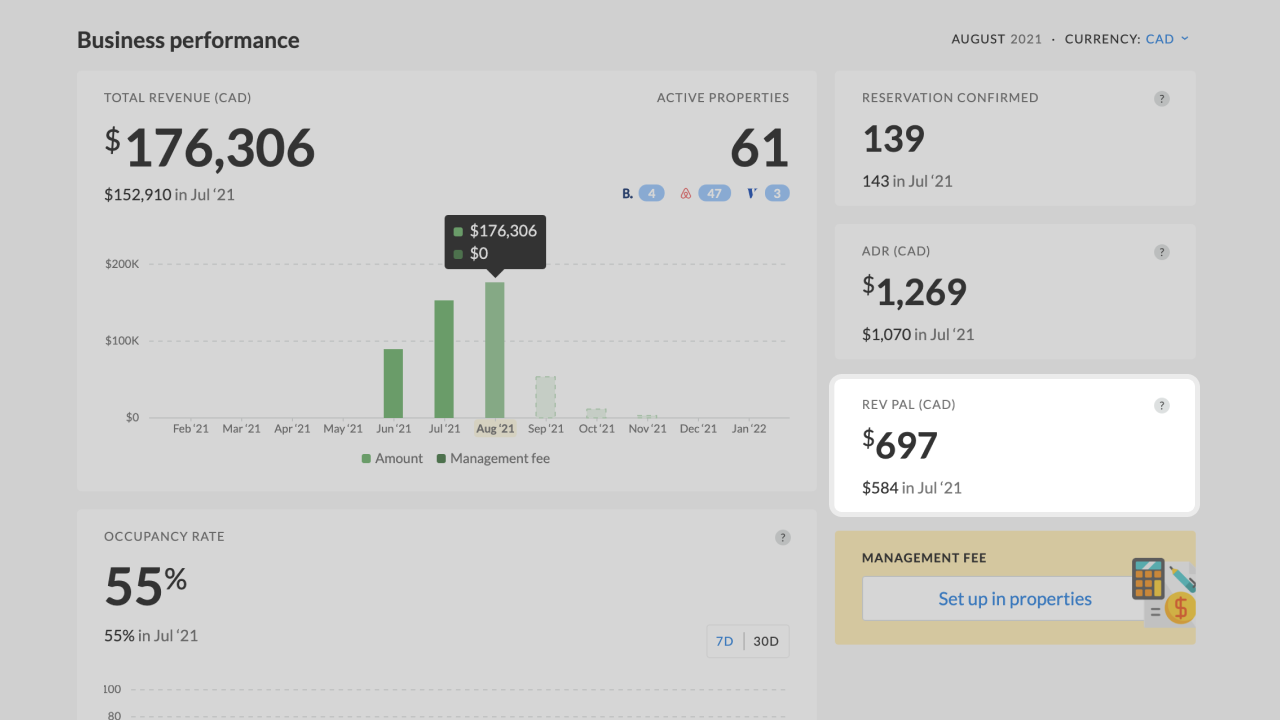
- Management fee which is a charge levied by a vacation rental management company or an individual professional for managing a property. You can set up a management fee for your properties in iGMS.
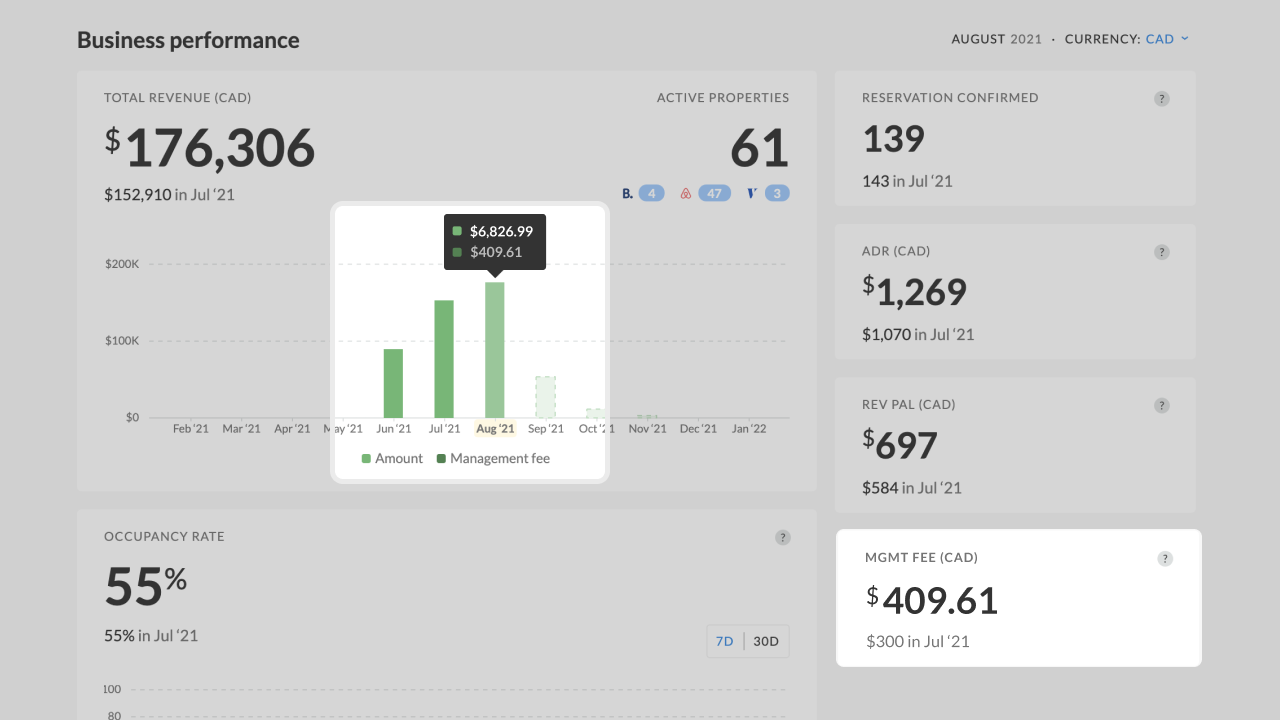
If you are not sure what a metric means, you can check the relevant tooltip next to it with an explanation on how the data are calculated.
How do I read my guest communication metrics?
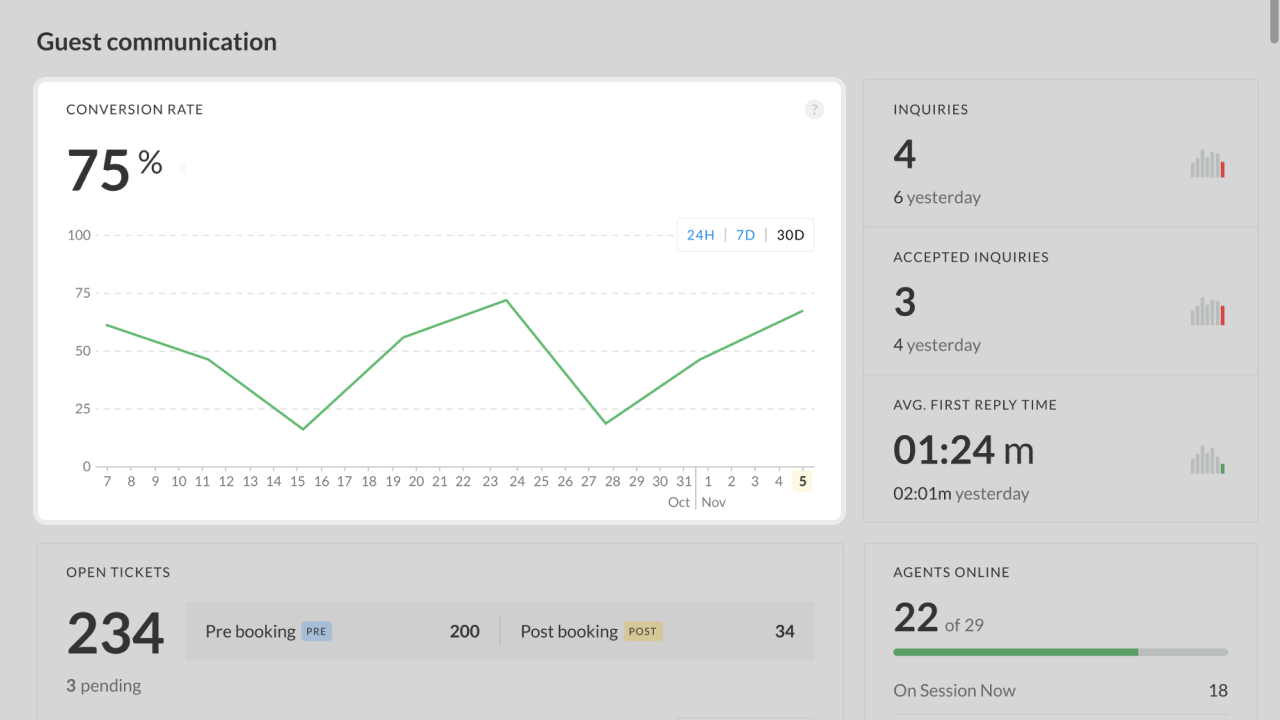
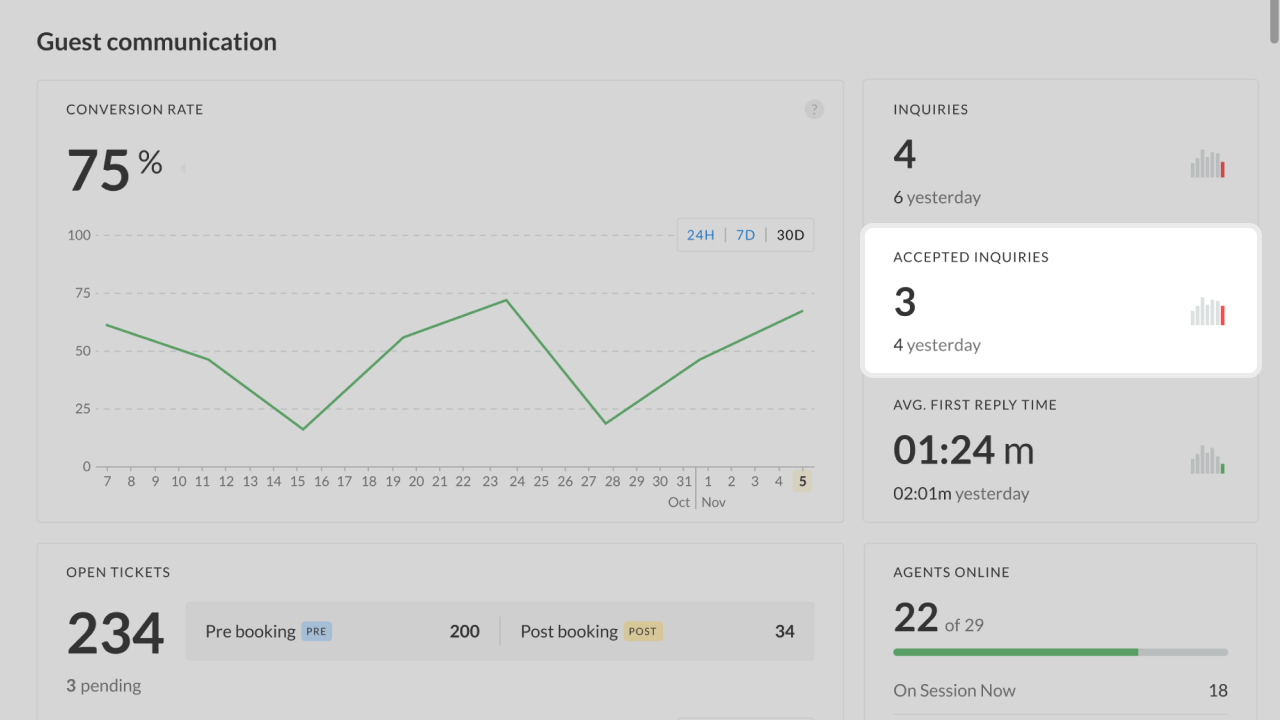
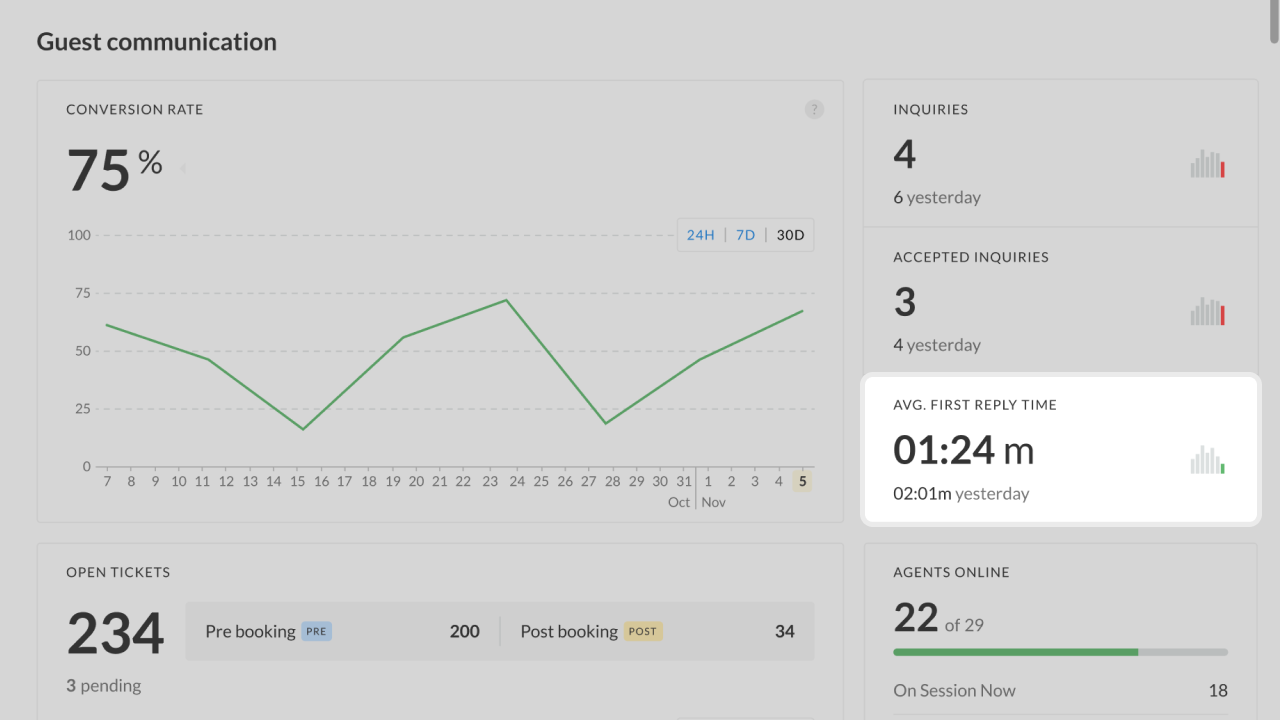
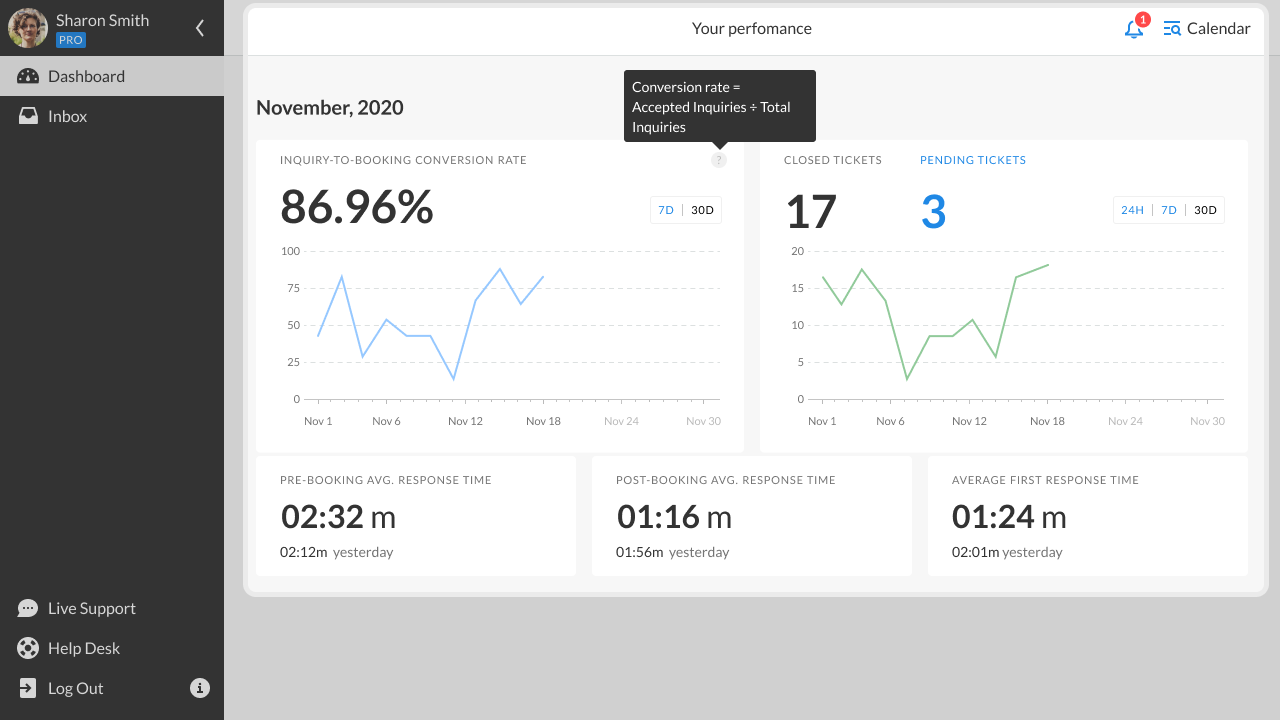
The Guest communication section reflects data and information of a current day and also lets you compare it to the day before. You can filter the inquiry-to-conversion rate to see the data for the last 7 or 30 days.
Here you will find:
- Inquiry-to-booking conversion rate which is calculated by dividing the number of accepted inquiries by the number of total inquiries
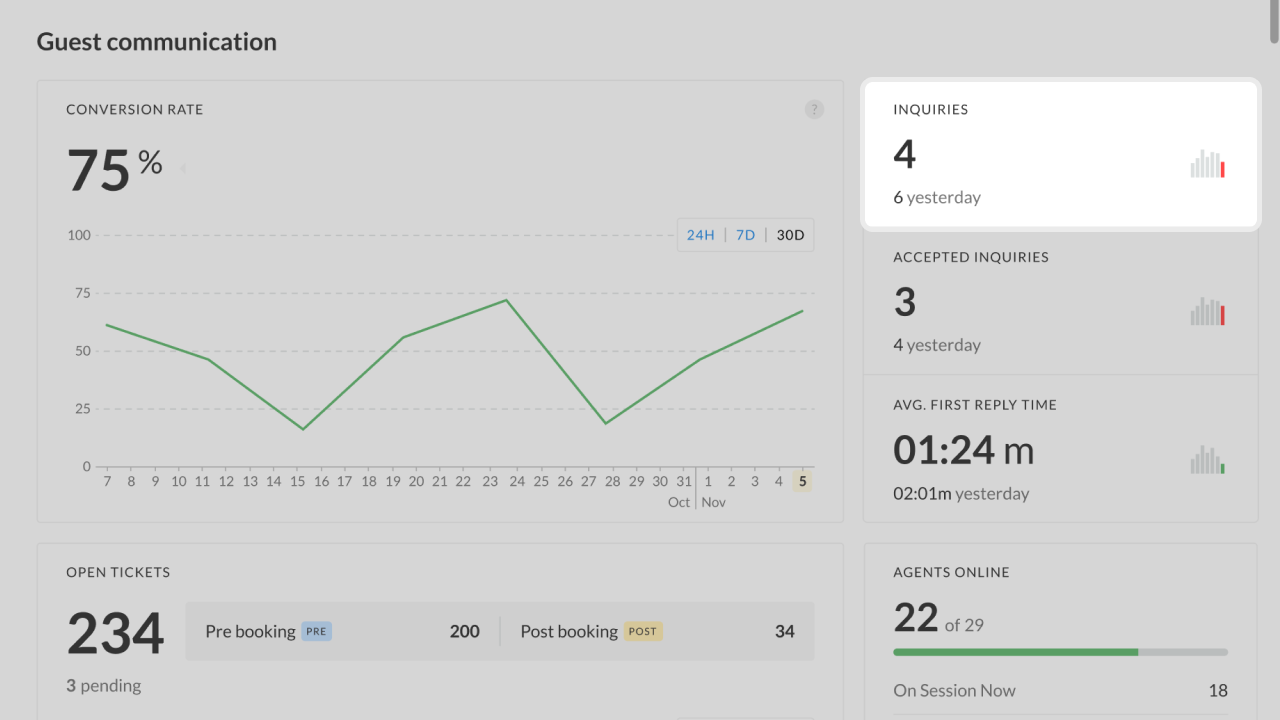
- Number of inquiries this month
- Number of accepted inquiries this month
- Average first response time of all agents
PROtrack metrics
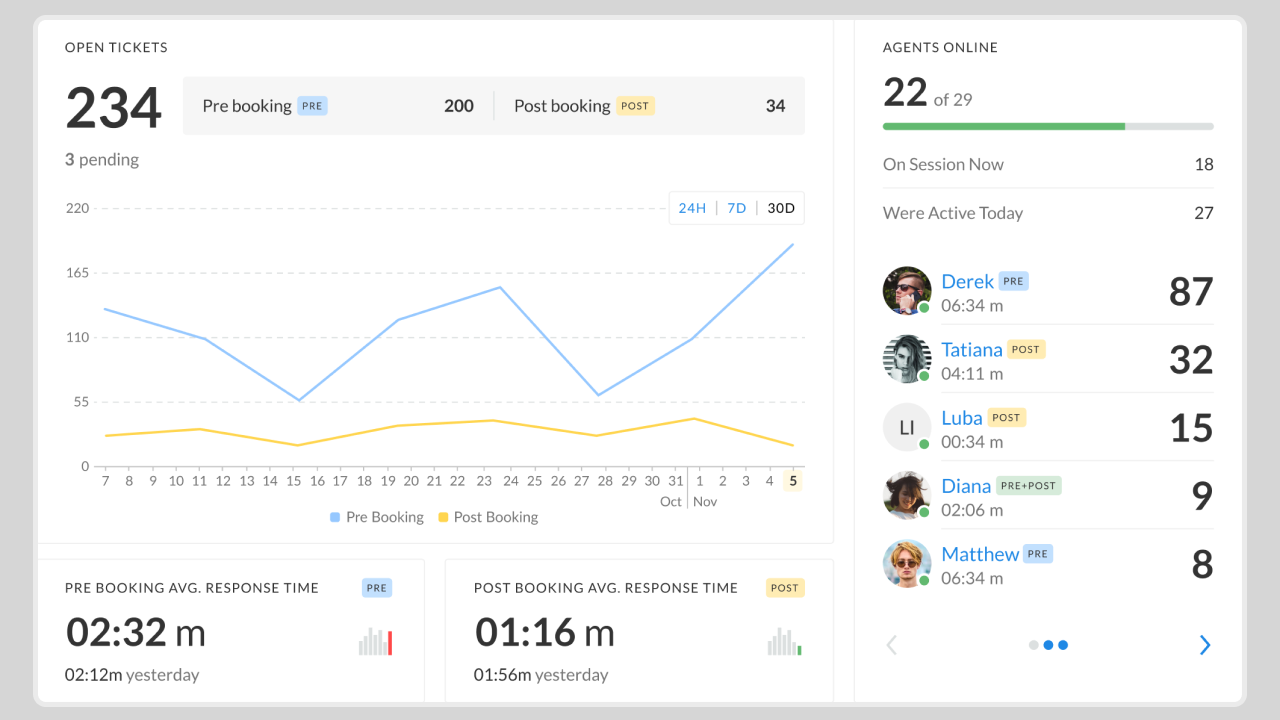
If you are one of the users who benefit from the PROtrack toolkit, you will also find some vital parameters aggregated in the dashboard to monitor your team’s performance:
- Number of open tickets that your Guest Support team is taking care of at the moment which are unread in the Inbox
- Number of the Guest Support agents online at this very moment and those who were online today
- Pre-booking average response time, indicating how fast your Guest Support team responds to incoming requests
- Post-booking average response time, indicating how fast your Guest Support handles guest requests after a reservation has been made.
How can my team members use the Dashboard?
The General Dashboard is also available to team members within iGMS.
The business performance part of the Dashboard is available to main iGMS account holders and such roles as Accountant, and Property Owner.
Guest Support users will have access to the guest communication metrics of their own performance.
Depending on the role and access, the data in the Dashboard will be presented differently.
-
Property Owners and Accountants
Property Owners and Accountants have access to the business performance section in iGMS, which includes total revenue, number of confirmed reservations, average daily revenue, Rev PAL, and occupancy rate.
Depending on their level of access, they will be able to see either only one or multiple properties and accounts that you select for them.
-
Guest Support agents
Guest Support agents, on the other hand, and anyone who has the Guest Communication permission will have access to the guest communication section in iGMS. They will see a summary of their individual performance related to the conversion rate, number of incoming inquiries, accepted inquiries, and average first response time.
In case you have any questions about the iGMS General Dashboard, feel free to reach out to our Customer Experience team via the product live chat or at support@igms.com.

